MTF Ichimoku Conversion Line SMA with H/L mirrored levelsWelcome to MTF Ichimoku Conversion Line with SMA Highs/Lows Extended Lines!
1. Overview
It is designed to provide a multi-timeframe view of market trends and potential support/resistance levels by obtaining a Simple Moving Average (SMA) of the Conversion Line of Ichimoku Equibilium (Ichimoku Kinko-Hyo), which acts as a substantial trend line on the candlestick chart. The SMA of the conversion line smooths out price fluctuations and indicates the overall trend direction—if the candles are above it, the trend can be read as an uptrend, while below it, the trend can be read as a downtrend.
2. Calculation
The indicator first calculates the Conversion Line (see the description of Ichimoku theory anywhere, e.g., Wikipedia), as the average of the highest high and lowest low over a user-defined period (Conversion Line Length, default is 9, also recommended is 9).
It then retrieves this Conversion Line from a higher timeframe (MTF Timeframe) to add a broader perspective. Using a specified period (SMA Length)., an SMA is computed on this multi-timeframe conversion line. This SMA serves as a trend line that visually represents the prevailing price trend, making it easier to assess market direction.
3. Pivot Highs/low detection and drawing their extensions
In addition, the indicator identifies pivot highs and lows from the SMA data using a defined pivot length. When these pivots occur, horizontal lines are drawn and extended across the chart. These extended lines (drawn in a yellowish color by default) include a full extension, a half extension, and a middle extension line representing the midpoint between the high and low pivot.
4. Mirror lines
The indicator also offers optional mirror line features. When the Mirror Upside option is enabled, five additional lines are drawn above the highest extended yellow line at equal intervals. Similarly, when the Mirror Downside option is enabled, five lines are drawn below the lowest extended yellow line. These light gray mirror lines serve as extra reference levels, which can help identify potential support or resistance zones.
5. Parameters
User parameters include:
- Conversion Line Length: The period used to calculate the conversion line.
- MTF Timeframe: The higher timeframe from which the conversion line is obtained.
- SMA Length: The period over which the SMA is calculated on the conversion line.
- SMA Mode: A toggle to display either the SMA or the raw conversion line (SMA recommended).
- SMA Line Width: The thickness of the SMA line.
- Pivot Length for SMA Highs/Lows: The period used to detect pivot highs and lows in the SMA.
- Horizontal Extension: Number of bars by which the pivot and extended lines are drawn across the chart
- Colors for High and Low Pivot Lines and Extended Lines: Customizable colors are used to draw the lines.
Mirror Upside and Mirror Downside: These options enable drawing additional mirror lines above and below the extended lines.
- Hide Old Lines: An option to hide previous pivot lines once new ones are drawn for a cleaner chart. Turned on by default.
6. Conclusion
Overall, the Conversion Line SMA in this indicator smooths out the conversion line data and effectively functions as a trend line for the candlestick chart, helping traders visually interpret the underlying market trend. The extended and mirror lines provide further context for potential price reversal or continuation areas, making this a powerful tool for multi-timeframe technical analysis.
ค้นหาในสคริปต์สำหรับ "MTF ichimoku"

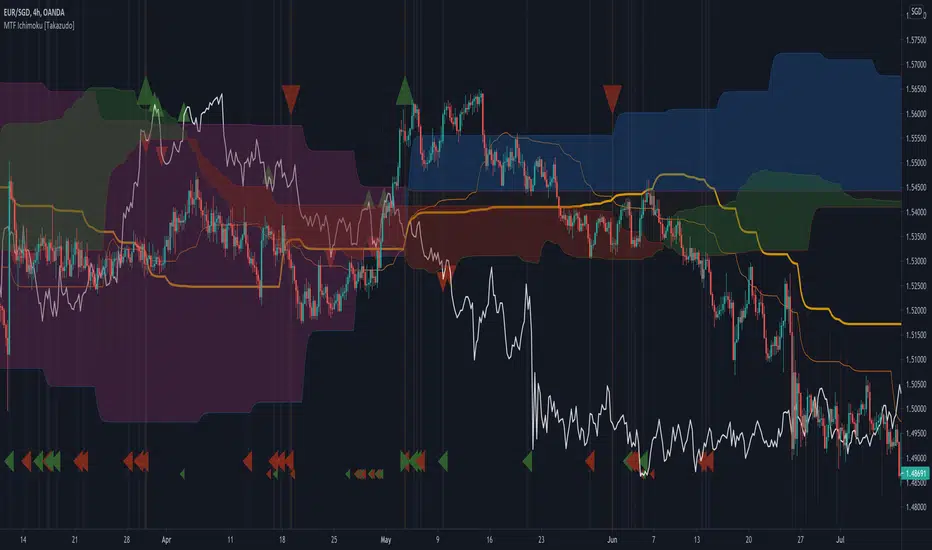
MTF Ichimoku [Takazudo]- A multi time frame Ichimoku with messy hint highlights.
- Most of MTF Ichimoku scripts doesn't handle Chikou-span's place correctly. This script does.
- This script was made to refer the 1day timeframe Ichimoku in lower timeframes.
- I use 1day timeframe mainly. But my entry is always in 4h or 1h timeframe.
OANDA:USDJPY
Pax24 MTF IchimokuPax24 Multiple Time Frames and Adaptative Ichimoku Cloud.
(based on the scripts : MTF Selection Framework by PineCoders and MTF ichimoku by anthonyf50)
Possible display :
- four differents Ichimoku, 1 current and 3 from higher UT (depending on your actual UT)
- Tenkan, Kijun, Chikou and Kumo for all
- labels : offset from line, color if you change style and with/without abbreviation
The 3 upper ichimoku you can display depends of your actual Time Frame :
- M1, M3 => M5 M15 H1
- M5 => M15 H1 H4
- M15, M30, M45 => H1 H4 D
- H1, H2, H3 => H4 D W
- H4, H6, H12 => D W M
- D => W M
- W => M
- M => none other
To add the indicator on your graph, go to "Indicators" then search for "Pax24 MTF Ichimoku" and add the script to your favorites.
-------- CONFIGURATION -------
Base : ichimoku numbers
ichimoku and +1 +2 +3 : Show the first ichimoku (actual UT) and 3 others (higher UT)
for each :
Tenkan : Show the Tenkan
Kijun : Show the Kijun
Chikou : Show the Chikou (Lagging span)
Kumo : Show the Kumo
Label : Show the labels
Offset : Label offset
Color : Label color (because you can't change the style of the label in "Style")
Abbreviation : Label abbreviation (Tk = Tenkan)
If you want to best see others UT kumo, change transparency in style for Kumo
There may be slow display since TradingView requires a minimum of candles to make these calculations. Just zoom out and then zoom in to fix the problem (especially for kumo).
[OZ]MTF Ichimoku CloudBased on this script from RicardoSantos:
This script can display Ichimoku cloud , SSA , SSB , Chikou, Kijun and Tenkan from another time frame.
With it you can apply Karen Péloille's MTF Ichimoku Kinko Hyo advanced trading techniques on TradingView.
By default Tenkan is not displayed (fully transparent).
The original script has been enhanced to draw the full cloud beyond the price and to draw the Chikou.

MTF Ichimoku Analysis[tanayroy]Ichimoku can state market conditions better than any indicator or group of indicators(My own perspective). Ichimoku works seamlessly in different timeframes. Analysis of Ichimoku in different timeframes can give you the bigger picture of the market.
This indicator analyzes six different timeframes with Ichimoku in depth. Default timeframes are 5M, 30M, 60M, D, W, and M. You can change the default timeframes from the setting.
As we are dealing with many relations, we can define the relationship with a simple score to get the trend strength.
Ichimoku Analysis:
Relationship of Price(P) with Ichimoku indicators: Here we are analyzing the current price and Ichimoku indicators. The position of price with respect to Ichimoku indicators states the market condition clearly.
Price(P) and Kumo(C): P > C = Bullish (↑). P < C = Bearish (↓). P <> C = consolidation or no trend(↔). Score: ±2
Price(P) and Tenkan Sen(T): P >= T = Bullish (↑). P < T = Bearish (↓). Score: ±0.5
Price(P) and Kijun Sen(K): P >= K = Bullish (↑). P < T = Bearish (↓). Score: ±0.5
Price(26 bars ago) and Chiku(L): L >= P(26) = Bullish (↑). L < P(26) = Bearish (↓). Score: ±0.5
Tenkan Sen and Kijun Sen Relation. Tenkan Sen depicts short-term trends and Kijun depicts mid-term trends. So this relationship is important for analyzing the current trend of the market.
Tenkan Sen(T) and Kijun Sen(K): T >= K = Bullish (↑). T < K = Bearish (↓). Score: ±2
Direction of Ichimoku indicators.
The direction of Ichimoku indicators helps us to understand the trend strength.
Tenkan Sen's(T) direction: Upward slope = Bullish (↑). Downward slope = Bearish (↓). Flat=consolidation or no trend(↔). Score: ±0.5
Kijun Sen's(K) direction: Upward slope = Bullish (↑). Downward slope = Bearish (↓). Flat=consolidation or no trend(↔). Score: ±0.5
Senkou A(A) direction: Upward slope = Bullish (↑). Downward slope = Bearish (↓). Flat=consolidation or no trend(↔). Score: ±0.5
Senkou B(A) direction: Upward slope = Bullish (↑). Downward slope = Bearish (↓). Flat=consolidation or no trend(↔). Score: ±0.5
Cloud and other Ichimoku indicators:
Kumo or Cloud is very important in the Ichimoku system. Analyzing its relation with other indicators is important to detect the overall market condition.
Kumo(C) and Tenkan Sen(T): T >= C = Bullish (↑). T < C = Bearish (↓). T <> C = consolidation or no trend(↔). Score: ±0.5
Kumo(C) and Kijun Sen(K): K >= C = Bullish (↑). K < C = Bearish (↓). K <> C = consolidation or no trend(↔). Score: ±0.5
Kumo(C) and Chiku(L): L >= C = Bullish (↑). L < C = Bearish (↓). L <> C = consolidation or no trend(↔). Score: ±0.5
Kumo(C) Shadow: By analyzing the last 252 bars(you can change this option) we are analyzing the Kumo shadow behind the current price. If Kumo shadow is present behind the price, trend strength will be weakened. Score: ±0.5
Kumo(C) Future (Senkou A(A) and Senkou B(B)): A >= B = Bullish (↑). A < B = Bearish (↓). Score: ±0.5
Chiku(L) Analysis:
Vertical and Horizontal Chiku analysis will tell us about the possible consolidation of the price.
Chiku Vertical: if the price consolidates for the next 5 bars(You can change this option) will it run into the price. Please remember we are placing the current price 26 bars ago and we are interested to see the current price in open space for a clear trend. Score: ±0.5
Chikou Horizontal: If Chiku is in open space (Not running into the price), we want to review Chiku vertically i.e how much percentage of fall or rise of the current price can cause Chiku to run into the price.
So, the maximum trend score is ±10.5.
Ichimoku signals:
We know, that the crossover of Ichimoku indicators provides important signals. In this section, you can see all the crossover i.e when they happened (Bars ago)
Distance between price and Tenkan Sen and Kijun Sen: We know, the price come back to Tenkan/Kijun if it goes far away from Tenkan/Kijun. So it is important to note the distance between Tenkan and Price.
Please note that this indicator is not a strategy or buy/sell signal. It just shows you the picture of Ichimoku in multiple timeframes. I am working on some strategies of Ichimoku and will publish the same when my research is complete.
If you want to analyze Ichimoku in a single timeframe, please review the following indicator.
To maintain the table size you can use the shorthand notation from the setting.
Table with detailed analysis:
Table with shorthand notation:
Please comment if you want any clarification or found any bugs to report.

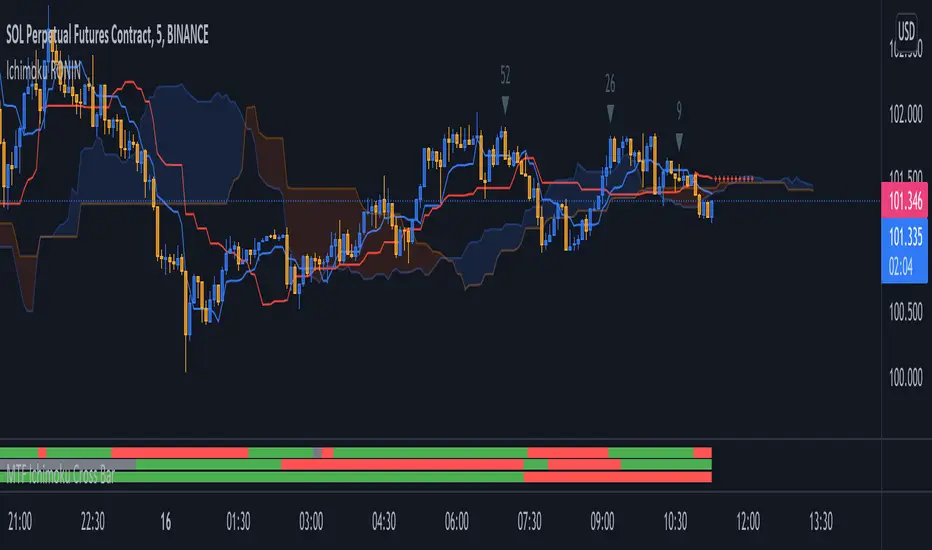
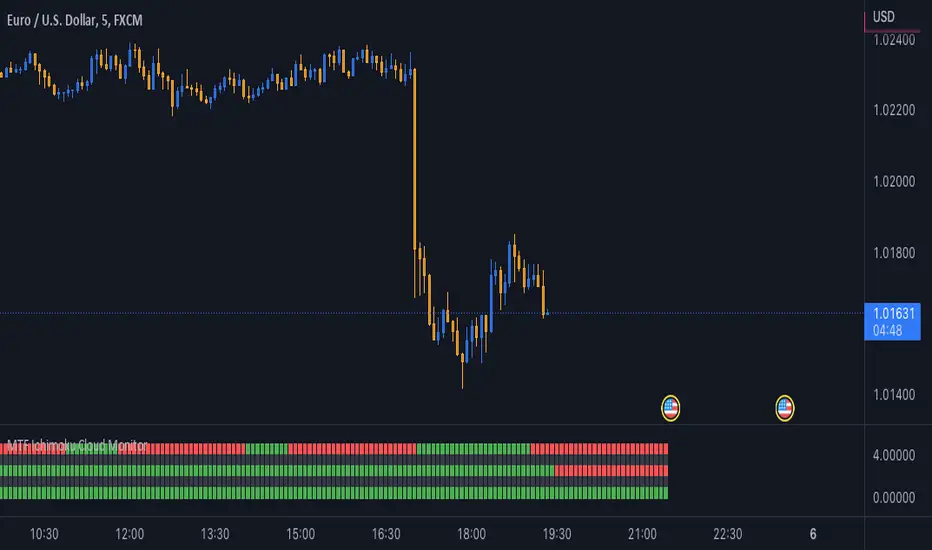
MTF Ichimoku Cross MonitorIchimoku Kinko Hyo is a technical analysis method that builds on candlestick charting to improve the accuracy of forecast price moves and Crossing TenkanSen ((HH + LL)/2 for the last 9 periods) & KijunSen (HH + LL)/2 for the last 26 periods) is One of major strategies on Ichimoku.
This Indicator build for Monitor Tenkansen & Kijunsen Lines status and you can watch 3 Time Frames Status on one bar and in one timeframe.
You can select timeframe and set Inputs for lines from Indicator setting.
Good trading to all ...
MTF Ichimoku CloudIchimoku Cloud , Multiple Time Frames, based on the script : MTF Selection Framework functions (PineCoders)
Possible display:
- four differents Ichimoku
- Tenkan, Kijun, Chikou and Kumo (monochrome or not)
- labels : offset from line, color if you change style and with/without abbreviation
Time Frames :
- 1m
- 3m
- 5m
- 15m
- 30m
- 45m
- 1h
- 2h
- 3h
- 4h
- Daily
- Weekly
- Monthly

MTF Ichimoku CloudI published it because I could not find a good MTF glance.
なかなか良いMTF一目が見つからないので公開しました。

MTF Ichimoku Signal [Takazudo]A multi timeframe Ichimoku Signal indicator. This indicator shows the status of each Ichimoku Signals.
1. TK-Cross
Tenkan-Sen & Kijun-Sen cross status
2. Future Kumo
The newest Kumo color
3. Kumo & Current Relation
The relation between current price & Kumo.
4. Kumo & Chikou-Span Relation
The relation between Kumo & Chikou-Span.
5. Chikou-Span & Candle Cross
Chikou-Span & Candle cross status

MTF Ichimoku CloudHere is my take on Ichimoku Cloud, Multiple Time Frames, based on the
most excellent work of "PineCoders" (MTF Selection Framework functions)!
The big advantage is that on 1 image you can easily see where
price is compared to Ichimoku Cloud patterns (each of different Time Frames).
This gives a lot of Support and Resistance area's!
I restricted the amount of MTF's at 2, more is just too messy
To make it more clear:
- Conversion line and Baseline in present timeframe : thick line
- Conversion line and Baseline in Higher Time Frame (HTF 1) : thin line
- Conversion line and Baseline in Higher Time Frame (HTF 2) : line with circles
All lines has labels at the right of the line with corresponding Time Frame
Since some prefer different settings with higher Time Frames,
each period in each Time Frame can be changed
The Time Frames itself can be chosen:
- or a multiple of present Time Frame
- or a fixed chosen Time Frame
Thanks!
MTF Ichimoku Cloud MonitorIchimoku Kinko Hyo is a technical analysis method that builds on candlestick charting to improve the accuracy of forecast price moves.
his Indicator build for Monitor SenkouSpanA & SenkouSpanB Lines (Kumo Cloud) status and you can watch 3 Time Frames Status on one bar and in one timeframe.
You can select timeframe and set Inputs for lines from Indicator setting.
Good trading to all ...
Ichimoku Kinkō hyō Keizen 改MTF善The script is not finnished yet and show's an other interpretation of how it could be scripted
Step -1 is complete... Basic Ichimoku with asjutable length and editable lines colors and visibilities.
Step -2 in progress... Adding ability to une multiple Spans, sens and Kumo on higher and lower timeframe.
Your Step : Like and Share ;) have a good year 2020 !
2020-01-06 /--------/ -R.V.
Jan 06
Release Notes: The script is not finnished yet and show's an other interpretation of how it could be scripted
Step -1 is complete... Basic Ichimoku with asjutable length and editable lines colors and visibilities.
Step -2 in progress... Adding ability to une multiple Spans, sens and Kumo on higher and lower timeframe.
Your Step : Like and Share ;) have a good year 2020 !
2020-01-06 /--------/ -R.V.
Jan 07
Jan 13
Release Notes: MTF Ichimoku is on it's way !!
Jan 17
Release Notes: The script is not finnished yet and show's an interpretation of how it could be scripted
Step -1 is complete... Basic Ichimoku with asjutable length and editable lines colors and visibilities.
Step -2 in complete... Adding ability to use multiple Spans, sens and Kumo on higher timeframe.
Step -3 in progress... Creating a UNIX based function to framgments actual chart periods in subcandles or "Subprices/periods" to plot multiple Spans, sens and Kumo on LOWER timeframe.
Your Step : Like and Share ;) have a good year 2020 !
/--------Coder--------/ -R.V.

[RS]MTF Ichimoku Cloud V0Request for T_C
The displacement cant be converted (a approximation is possible by calculating the n_bars the time frame occupies by the displacement).
